Now that the DVLA is all tucked away and listening under the ice, we need to play it some music! …well, we need to play it something anyway. We have two sound sources, the J-15 and the HLF-5, and we are lowering one down in the water and transmitting sound on and off for about a day and then lowering the other one down into the water and transmitting. We did this first at 50 km from the DVLA and then 100 km from the DVLA and now we are on our way to a spot 200 km away. We are going to see how far we can get before our time is up on this research cruise.
One reason that we are doing this is because we want to know how far sound travels in the Arctic Ocean and how what we receive on the hydrophones changes depending on the distance that we are transmitting over. Because the sound travels from the source through a bunch of water to the hydrophone receiver, the sound that we receive on the hydrophone can tell us a lot about the water through which the sound traveled.
Sound travels a lot farther and faster underwater than it does in air, but we also have some tricks up our sleeve to actually “hear” the sound at these long ranges. The J-15 and the HLF-5 sources are sending coded signals called m-sequences over and over again. The J-15 sends signals at around 75 Hz and 125 Hz and the HLF-5 sends signals at 250 Hz, which is about a middle C on the piano – actually a pretty flat middle C for the musicians out there! After we receive the sound, we decode the signals and separate all of the different repetitions of the signal. We then add all the different repetitions of the signal together to get a bigger signal. This makes it easier to pick the signal out from the background noise. This way we can get a signal to appear louder without actually playing the source louder. We call this signal processing gain.
Tuesday, August 11, 2015
Saturday, August 8, 2015
The Pink Hard Hat Makes a Comeback
We have now finished our biggest job out here, which was to deploy a mooring called the Distributed Vertical Line Array (DVLA). This DVLA is an basically a long wire with hydrophones clamped onto it, which is anchored to the bottom of the ocean and held upright by a buoy that sits below the water surface. Since it was a big day out on the deck of the Sikuliaq, with cranes operating and heavy equipment being moved around, I had to bust out my signature pink hardhat. Deploying an array like this is a big job and there were a lot of people involved as you can see from all the orange float coats out on deck (they are nice and warm and have built-in flotation).![]() |
| Photo credit: Bruce Thayer |
![]() |
| Photo credit: Scott Carey |
![]() |
| Photo credit: Scott Carey |
We deployed a similar mooring in the Philippine Sea Experiment, but because we are now surrounded by ice, we had to do things a little bit differently up here in the Arctic. In the Philippine Sea, we first put the buoy over and then strung out a bunch of wire rope and instruments that all floated at the surface in a big line strung out behind the ship until we and finally dropped the anchor and the whole thing followed the anchor down as it sank. Well, we can’t string out several kilometers of wire rope and instruments up here because we are surrounded by ice! This time, we had to put the anchor in first and slowly lower the wire in after it, clamping on all the instruments as we went, and then we finished up with the buoy. The DVLA was already mostly vertical and in the correct orientation so it just sunk straight down when we dropped the buoy. Basically we did it just backwards of the way that we did it in the Philippine Sea.
The water depth was about 3850 meters (approximately 2.4 miles) and the buoy is about 50 meters below the surface, so the mooring itself was about 3800 meters long. We attached 60 hydrophone modules (see HM post from PhilSea) as well as 24 MicroCAT instruments. The CAT in MicroCAT stands for Conductivity And Temperature, which is what the instruments measure, and what we what we need in order to calculate the speed of sound in the ocean. The way sound travels in the Arctic Ocean is largely dependent on the temperature and salinity changes that result from interactions with the ice, which happens near the surface of the ocean (we’ll talk more about that later). The hydrophones and other oceanographic instruments were concentrated towards the top of the mooring to capture all this excitement in the upper ocean.
Tuesday, July 28, 2015
Sikuliaq (“Si-COOL-i-ak” - Emphasis on the COOL!)
![]() |
| R/V Sikuliaq breaking ice in July 2015 |
The Sikuliaq is operated by the University of Alaska Fairbanks on behalf of the National Science Foundation, and her home port is Seward, Alaska. The Sikuliaq is a brand new ship that just left the shipyard last year, so it has all new state-of-the-art equipment.
At 261 feet long, the Sikuliaq is a pretty big ship as far as research vessels go. The main level of the ship is mostly outdoor deck space, which is great for doing moorings and storing big equipment. There is also a main lab, a wet lab, a computer lab, an analytical lab (for chemists and biologists) and a Baltic room, which is kind of like a big garage. They have a great heater set-up in there for when you’re cold on deck and need to warm up quick!
On the next deck up are the galley (kitchen), mess (dining room) and the lounge, as well as the science berthing. There is berthing space for 24 scientists, and since there are only 12 of us in the science party on this cruise, it is nice and roomy. The next two floors are berthing spaces for the crew, and then the bridge is up top. The bridge is where the captain and the mates drive the ship, and it has the best view for watching the ice break.
Also, because the Sikuliaq operates primarily in the icy Arctic, it even has a sauna! I haven’t tested it out yet, but I will. Oh yes I will.
Monday, July 27, 2015
Feeling HARPy
The main event of this research cruise is putting out an array of hydrophone (underwater microphone) receivers and transmitting sound to them from a ship-based source, which we will get to in a few days, but there are a lot of other things going on as well! Today we are steaming to the location of a HARP, which stands for High-frequency Acoustic Recording Package. This instrument package has been out here for a year recording the sounds of the Arctic, also called the Arctic soundscape.![]() |
| Bruce Thayre |
The HARP is on a small mooring with an anchor at the bottom, then 4 meters of chain, then acoustic releases, then another 4 meters and then the HARP package, which consists of 3 tubes containing the recording electronics, the disks, and the batteries. The hydrophone itself is attached by a rope and sits above the recording package.
The HARP records at a rate of 200,000 samples per second (200 kHz). The HARP could record for 10 months continuously at this rate, but scientists are really interested in knowing how the soundscape changes through the cycle of an entire year, so the HARP is programmed to record at a duty cycle of 2/3, which means it samples 2/3 of the time, and lasts for the entire year.
HARPs have been deployed up here in the Arctic since 2006 and have recorded sounds from bowhead whales, beluga whales, ringed seals, bearded seals, ribbon seals, and once even a walrus. They also record passing ships, wind and rain sounds, and lots and lots of ice breaking.
Friday, July 24, 2015
Back for More Adventures in Acoustic (and Arctic!) Oceanography
This time we are heading waaaaay up North to the Arctic Ocean. A lot of melting has been going on in the Arctic in recent years
and scientists are interested in finding out how fast the ice is melting and how
this melting affects the physical oceanography of the region, as well as the
rest of the globe. On this expedition, we will be exploring how sound travels
underwater and under ice and how acoustic data can help us learn about the
changing Arctic.
![]() |
| R/V Sikuliaq |
For those of you who have never been to Nome (not many people have!), it is a city in Alaska with a population of about 3800 people. It is located at approximate latitude 64.5 degrees North and longitude165.4 degrees West, and is actually closer to Siberia than it is to the mainland United States. Because it is so far north, and because it is summertime right now, it is light outside almost all day and all night. The sun doesn’t even set until after midnight! July is actually the warmest month in Nome, and the average high temperature is 58 degrees F (break out your swim suits!). Nome is a gold rush town (any fans of the reality series Bering Sea Gold out there?) and is also the end-point of the famous Iditarod dog sled race.
Tuesday, April 5, 2011
We caught a mooring.....and a fish!


Some rough weather at the start of the cruise slowed us down a bit, but over the last week our crew has been busy recovering moorings. So far we have picked up 3 of the source moorings and the vertical receiver array mooring.
We've had some exciting moments during these recoveries! On Monday, we discovered that the mooring wire had become entangled with fishing line and our mooring had caught a rather large fish! The pictures (taken by the Able Sea Chicks good friend Mr. Lloyd Green) show the fish coming out of the water and on deck, just before it was cut off the line and fell back into the water. You should be grateful that these pictures can't convey smell! This tuna had been dead a long time and had quite a strong aroma.
There was quite a lot of line wrapped up in the mooring. The third picture shows three of our science crew (Meghan, Matt, and Jim) cleaning up the tangled wire.
Saturday, April 2, 2011
Roomba's seagoing sister

Seagliders are underwater robots made by the company iRobot, the same company that makes the Roomba (you know, that vacuum cleaner that zooms around your house all by itself while you aren’t home)! Well, the company may be the same, but these gliders are not out there cleaning up the Pacific Garbage patch or anything. (That would be cool, though wouldn’t it?!) Instead of cleaning, these gliders are actually out there taking oceanographic measurements. They dive down to about 1000 meters and then back up to the surface, measuring temperature and salinity along the way. Gliders dive for about 8 hours at a time. When they come to the surface they stick their tail up in the air (the tail is an antenna) to communicate with a satellite. They get their latitude and longitude position from GPS and then they send back the temperature and salinity data that they collected during the dive. While they are at the surface the Seaglider pilots can also tell them where to go on the next dive.
The University of Hawaii put out four Seagliders in November and now Lora is here to pick them all up and bring them back to Hawaii. We have just one more to pick up, Seaglider 513. We are tracking it while we are out here at sea, so we know exactly where it is. When we take a break from recovering moorings, we will go out and grab it! You can follow it too, if you’d like. Check out the glider web page at: http://hahana.soest.hawaii.edu/seagliders/history513.html
Friday, March 25, 2011
Overview
We were eager to start recovering our moorings, but the sea is pretty choppy today, so we are going to wait until tomorrow. While we’re waiting, we thought we’d give you a little refresher as to what we are doing out here so that you know what to expect in the co
ming weeks.
As you may recall, last year we deployed six acoustic sources and a Distributed Vertical Line Array (DVLA) in the Philippine Sea. The map shows the locations of the 6 sources and the DVLA. Right now we are at he location of Source 5. The DVLA consists of approximately 5km of wire with 150 hydrophones (underwater microphones) attached to it. Each of the six source moorings also has a smaller array with four hydrophones on it. All of the moorings are anchored to the bottom and held vertical by a subsurface buoy. The basic idea is to transmit sound back and forth between the different sources to map out the temperature and currents of the ocean in between the moorings. Check out our earlier post “An ocean acoustic tomography experiment” for more info.
The sources have been out here transmitting and collecting data for almost a year now, so we are going to go pick up the moorings one by one and start downloading the data. We are also going to be making some of the same types of measurements we made during our last cruise. For example, we plan to make more maps of the ocean floor between our moorings (see our post Sounding Out the Ocean’s Depths) and we will be doing some more CTDs (see our post Good Morning CTD). In addition we have a couple other exciting side projects that are going on during this cruise as well. We will be recovering a couple acoustic seagliders, which are underwater robots that have been listening to the sources and measuring temperature and salinity in the upper ocean. We'll also be sampling some mud from the bottom of the ocean!
ming weeks.As you may recall, last year we deployed six acoustic sources and a Distributed Vertical Line Array (DVLA) in the Philippine Sea. The map shows the locations of the 6 sources and the DVLA. Right now we are at he location of Source 5. The DVLA consists of approximately 5km of wire with 150 hydrophones (underwater microphones) attached to it. Each of the six source moorings also has a smaller array with four hydrophones on it. All of the moorings are anchored to the bottom and held vertical by a subsurface buoy. The basic idea is to transmit sound back and forth between the different sources to map out the temperature and currents of the ocean in between the moorings. Check out our earlier post “An ocean acoustic tomography experiment” for more info.
The sources have been out here transmitting and collecting data for almost a year now, so we are going to go pick up the moorings one by one and start downloading the data. We are also going to be making some of the same types of measurements we made during our last cruise. For example, we plan to make more maps of the ocean floor between our moorings (see our post Sounding Out the Ocean’s Depths) and we will be doing some more CTDs (see our post Good Morning CTD). In addition we have a couple other exciting side projects that are going on during this cruise as well. We will be recovering a couple acoustic seagliders, which are underwater robots that have been listening to the sources and measuring temperature and salinity in the upper ocean. We'll also be sampling some mud from the bottom of the ocean!
Thursday, March 24, 2011
Back, by popular demand

The able sea chicks are back! Remember all those moorings we deployed last year? Well, the time has come for us to head back out into the Philippine Sea to recover them and download all the data that has been collected over the past year.
We are experiencing a little deja vu as we sail out of the harbor in Kaohsiung, Taiwan on the R/V Roger Revelle, but a lot has happened since we set out on our deployment cruise a year ago.
Able Sea Chick Kathleen finished up her sabbatical at the Scripps Institution of Oceanography in San Diego and is back teaching at George Mason University. Lucky for us, she could take a few weeks off and join us for another oceanographic expedition.
Able Sea Chick Lora finished up her postdoc at Scripps, and has started a research position at the University of Hawaii (Aloha!). She was out on the Revelle here in the Philippine Sea last November to deploy acoustic Seagliders, which have been swimming around the moorings making measurements since that time. We will be recovering two of these gliders during this cruise and will tell you all about them in later posts.
Welcome aboard for another cruise, and feel free to spy on us on the ship's webcam.
Tuesday, May 18, 2010
Mission Accomplished!
After 3 weeks at sea and 7 (successful!) mooring deployments, we are now safely back in San Diego. Even the dock rock (when you close your eyes and still feel the motion of the ocean) and jet lag are in the past. Now comes the hard part: sitting back and waiting for a whole year until we can go back and collect our data!
A lot of people ask if it is hard to be on a ship for such a long time, but it's really not as intolerable as you might think. Since the ship is only about 300 feet long, we just had to climb up or down a ladder to get pretty much everything we needed, whether it was a snack, a nice cozy bunk, or a place to do laundry.
Although the Revelle can accommodate up to 37 scientists, we only had 12 people in our science party so we each got our own stateroom. The staterooms each have two bunks, dresser drawers, a desk, and a sink. There is a bathroom, or "head" as we call it at sea, shared between two staterooms.
We had three meals prepared for us every day in the galley, which is what we call the kitchen on the ship, and there was ice cream and other treats available at all hours. To counter all the intake of food, there is an exercise room with a stationary bicycle, rowing machine, treadmill (jogging in place on a moving ship can be quite an adventure!), and a stair-stepper. The ship also has public computers with internet connectivity, a library full of books, a lounge with a TV and hundreds of DVDs, and even a Wii!
That said, it is nice to be back on solid ground where we don't have to worry about the seas knocking us over in the shower or sliding our lunch off the table if we aren't paying attention!
We would like to thank to the Office of Naval Research for funding the experiment and Dr. Peter Worcester, the chief scientist, for leading it. We couldn't have done it without Captain Desjardens and the crew of the R/V Roger Revelle, especially the resident and computer techs Josh, Brent, and John. We would also like to acknowledge the hard work of the rest of the science crew:
Rex Andrew (University of Washington)
Scott Carey (Scripps Institution of Oceanography)
Jim Dunn (Woods Hole Oceanographic Institution)
Matt Dzieciuch (Scripps Institution of Oceanography)
Lloyd Green (Scripps Institution of Oceanography)
David Horwitt (Scripps Institution of Oceanography)
John Kemp (Woods Hole Oceanographic Institution)
Matt Norenberg (Scripps Institution of Oceanography)
Marla Stone (Naval Postgraduate School)
We also thank you for following along with us in the Philippine Sea! We hope that you have learned a little bit about acoustical oceanography and that you have enjoyed the adventure! If this blog sparked your interest in studying ocean science, and acoustics in particular, we encourage you to learn more about it. The Discovery of Sound in the Sea website has some great resources, as does the Scripps Institution of Oceanography website. Your local aquarium probably has great exhibits, too. Whatever you do, we encourage you to keep learning about the ocean!
A lot of people ask if it is hard to be on a ship for such a long time, but it's really not as intolerable as you might think. Since the ship is only about 300 feet long, we just had to climb up or down a ladder to get pretty much everything we needed, whether it was a snack, a nice cozy bunk, or a place to do laundry.
Although the Revelle can accommodate up to 37 scientists, we only had 12 people in our science party so we each got our own stateroom. The staterooms each have two bunks, dresser drawers, a desk, and a sink. There is a bathroom, or "head" as we call it at sea, shared between two staterooms.
We had three meals prepared for us every day in the galley, which is what we call the kitchen on the ship, and there was ice cream and other treats available at all hours. To counter all the intake of food, there is an exercise room with a stationary bicycle, rowing machine, treadmill (jogging in place on a moving ship can be quite an adventure!), and a stair-stepper. The ship also has public computers with internet connectivity, a library full of books, a lounge with a TV and hundreds of DVDs, and even a Wii!
That said, it is nice to be back on solid ground where we don't have to worry about the seas knocking us over in the shower or sliding our lunch off the table if we aren't paying attention!
We would like to thank to the Office of Naval Research for funding the experiment and Dr. Peter Worcester, the chief scientist, for leading it. We couldn't have done it without Captain Desjardens and the crew of the R/V Roger Revelle, especially the resident and computer techs Josh, Brent, and John. We would also like to acknowledge the hard work of the rest of the science crew:
Rex Andrew (University of Washington)
Scott Carey (Scripps Institution of Oceanography)
Jim Dunn (Woods Hole Oceanographic Institution)
Matt Dzieciuch (Scripps Institution of Oceanography)
Lloyd Green (Scripps Institution of Oceanography)
David Horwitt (Scripps Institution of Oceanography)
John Kemp (Woods Hole Oceanographic Institution)
Matt Norenberg (Scripps Institution of Oceanography)
Marla Stone (Naval Postgraduate School)
We also thank you for following along with us in the Philippine Sea! We hope that you have learned a little bit about acoustical oceanography and that you have enjoyed the adventure! If this blog sparked your interest in studying ocean science, and acoustics in particular, we encourage you to learn more about it. The Discovery of Sound in the Sea website has some great resources, as does the Scripps Institution of Oceanography website. Your local aquarium probably has great exhibits, too. Whatever you do, we encourage you to keep learning about the ocean!
Tuesday, April 27, 2010
Able Sea Chick (and Girl Scout!) Marla Stone
Marla Stone, another member of the science party here on the R/V Revelle, is even abler a sea chick than we are! She has practically lived her life on the ocean, captaining fishing boats and scuba diving boats and even working for the state as a scuba diver doing inspections. Marla now goes to sea in the name of science and has been doing oceanography cruises while working for the Naval Postgraduate School (NPS) in Monterey, California for the past 21 years.
Growing up in the 1960s in Claremont, California, Marla was a girl scout from the time she was in 3rd grade through the time she reached seniors in the 9th grade. She has some wonderful memories from her girl scout days and told us about a time her troop chartered a sailboat, the Swift of Ipswich, and sailed it from Santa Barbara out to the Channel Islands. She said they felt like they were pirates, paddling around in rowboats, singing pirate songs, swimming, and sleeping in hammocks. She also remembers being impressed by the marine life they saw, like a basking shark and a pod of dolphins.
One meets a lot of interesting people at sea, and living on a ship with Marla for the past few weeks gave us a great opportunity to get to know her better and hear some of her sea stories. We also had a couple questions for her about what her job is like and how she ended up doing the work that she does.

US: How did you get interested in marine science?
MARLA: I grew up in the mountains, but always loved reading books about the ocean and stories about sailing. I was particularly influenced by the book The Silent World, by Jacques Cousteau. I was 13 years old when I read that book and decided then and there that I wanted to spend my life learning about the ocean. I took lots of math and science classes when I was in high school and had my heart set on studying oceanography.
US: What exactly is your job?
MARLA: My official title at NPS is Staff Oceanographer. I design moorings and then go out and deploy them in the ocean. People tell me where they want to make measurements and I design a mooring based on what the currents are like at their chosen site, how deep the water is, and what kind of instruments they want on the mooring. I do a lot of work with instrumentation and data collection, but I don't do much data analysis. I enjoy the independence of my job and the fact that I don't have to sit in front of a computer all day.
US: What education did you need for your job?
MARLA: I went to Humboldt State University in Northern California and got a bachelor's degree in oceanography, just like I always wanted. Oceanography is not a common college major, and in the 1970s they didn't know what to do with an oceanography degree so they required another one. I then earned a separate degree in biology. After that, I went to Moss Landing Marine Labs to get a master's degree. I got a lot of field experience while working on the degree, but left to work as a ship's captain. When I started at NPS, I finished my master's degree in physical oceanography.
US: What lead you to your current position?
MARLA: I randomly walked into NPS one day, figuring that if it was run by the Navy it had to have something to do with oceanography, and asked if they were hiring. They told me they needed somebody to do mooring work, and when they heard about the experience I had from college and at Moss Landing, they took me directly to chairman of department and told me I could start work the next day. I've been there keeping the mooring program alive and well ever since.
US: How often do you go to sea?
MARLA: It varies from year to year depending on what is going on. Generally I go on about 8-10 sea trips per year. Some of them last several weeks, like this one, and some are just a couple of days.
When Marla started working in oceanography, it was not as common to see women on a research vessel. In fact, on one research cruise, they had Marla stay in the sick bay because she was the only woman aboard and there was not a room for her! This didn't bother Marla, though. She said she was always the first girl they every hired for every job she had growing up, including fixing cars, working at a hydroelectric power plant, working at a boat shop, and captaining a dive boat. When she was captain of the dive boat, she was actually the only female captain on the west coast at the time! Marla's story is an inspiring one about following a dream and not letting anything stop her. We can attribute much of the opportunity we have today to pioneers (and ABLE SEA CHICKS!) like Marla.
Growing up in the 1960s in Claremont, California, Marla was a girl scout from the time she was in 3rd grade through the time she reached seniors in the 9th grade. She has some wonderful memories from her girl scout days and told us about a time her troop chartered a sailboat, the Swift of Ipswich, and sailed it from Santa Barbara out to the Channel Islands. She said they felt like they were pirates, paddling around in rowboats, singing pirate songs, swimming, and sleeping in hammocks. She also remembers being impressed by the marine life they saw, like a basking shark and a pod of dolphins.
One meets a lot of interesting people at sea, and living on a ship with Marla for the past few weeks gave us a great opportunity to get to know her better and hear some of her sea stories. We also had a couple questions for her about what her job is like and how she ended up doing the work that she does.
US: How did you get interested in marine science?
MARLA: I grew up in the mountains, but always loved reading books about the ocean and stories about sailing. I was particularly influenced by the book The Silent World, by Jacques Cousteau. I was 13 years old when I read that book and decided then and there that I wanted to spend my life learning about the ocean. I took lots of math and science classes when I was in high school and had my heart set on studying oceanography.
US: What exactly is your job?
MARLA: My official title at NPS is Staff Oceanographer. I design moorings and then go out and deploy them in the ocean. People tell me where they want to make measurements and I design a mooring based on what the currents are like at their chosen site, how deep the water is, and what kind of instruments they want on the mooring. I do a lot of work with instrumentation and data collection, but I don't do much data analysis. I enjoy the independence of my job and the fact that I don't have to sit in front of a computer all day.
US: What education did you need for your job?
MARLA: I went to Humboldt State University in Northern California and got a bachelor's degree in oceanography, just like I always wanted. Oceanography is not a common college major, and in the 1970s they didn't know what to do with an oceanography degree so they required another one. I then earned a separate degree in biology. After that, I went to Moss Landing Marine Labs to get a master's degree. I got a lot of field experience while working on the degree, but left to work as a ship's captain. When I started at NPS, I finished my master's degree in physical oceanography.
US: What lead you to your current position?
MARLA: I randomly walked into NPS one day, figuring that if it was run by the Navy it had to have something to do with oceanography, and asked if they were hiring. They told me they needed somebody to do mooring work, and when they heard about the experience I had from college and at Moss Landing, they took me directly to chairman of department and told me I could start work the next day. I've been there keeping the mooring program alive and well ever since.
US: How often do you go to sea?
MARLA: It varies from year to year depending on what is going on. Generally I go on about 8-10 sea trips per year. Some of them last several weeks, like this one, and some are just a couple of days.
When Marla started working in oceanography, it was not as common to see women on a research vessel. In fact, on one research cruise, they had Marla stay in the sick bay because she was the only woman aboard and there was not a room for her! This didn't bother Marla, though. She said she was always the first girl they every hired for every job she had growing up, including fixing cars, working at a hydroelectric power plant, working at a boat shop, and captaining a dive boat. When she was captain of the dive boat, she was actually the only female captain on the west coast at the time! Marla's story is an inspiring one about following a dream and not letting anything stop her. We can attribute much of the opportunity we have today to pioneers (and ABLE SEA CHICKS!) like Marla.
Monday, April 26, 2010
Hydrophones galore!
A couple days ago we deployed the final mooring of this cruise: a large receiving array located inside the pentagon of our set of source moorings. This array contained 150 hydrophone modules that are set up to listen to the sources.
The picture below shows what a hydrophone module looks like when it is opened up:

The silver colored case on the left is the pressure case. It is what keeps the electronics (the parts on the right) from being crushed when the module is deployed deep in the ocean. On the right side, you can see the lithium battery that powers the module during the year it sits in the ocean. The part labeled "inductive modem enables communication between the module and a control unit located above it on the array. The control unit tells the module when it should turn on and listen to the sources. Of course the module has to have someplace to record the sounds it hears from the sources. An SD card (like the one you probably have in your digital camera) is used to store the recordings. The hydrophone (the underwater microphone) is inside the blue tube at the bottom of the module.
Before we could deploy all these modules, we had to run a series of tests on them to make sure they worked properly. The following video clip shows how we tested that the hydrophone was working before we sealed everything up.
The picture below shows what a hydrophone module looks like when it is opened up:

The silver colored case on the left is the pressure case. It is what keeps the electronics (the parts on the right) from being crushed when the module is deployed deep in the ocean. On the right side, you can see the lithium battery that powers the module during the year it sits in the ocean. The part labeled "inductive modem enables communication between the module and a control unit located above it on the array. The control unit tells the module when it should turn on and listen to the sources. Of course the module has to have someplace to record the sounds it hears from the sources. An SD card (like the one you probably have in your digital camera) is used to store the recordings. The hydrophone (the underwater microphone) is inside the blue tube at the bottom of the module.
Before we could deploy all these modules, we had to run a series of tests on them to make sure they worked properly. The following video clip shows how we tested that the hydrophone was working before we sealed everything up.
Thursday, April 22, 2010
Where in the world is the mooring?
When we deploy an acoustic mooring, we start with the buoy (the big yellow top float) first. Then we attach more wire and instruments as the ship slowly moves forward. By the time we're ready to attach the anchor, we have about 3.5 miles of wire strung out behind the ship. The last step in the deployment is to dump the anchor and let it sink to the bottom. The anchor pulls the rest of the mooring underwater.
We let go of the anchor at our chosen site, but the anchor doesn't fall straight to the bottom because it's being dragged back by the buoy and other equipment on the 3.5 mile wire. After the anchor has reached the bottom (it takes about 50 minutes), we have to do a survey to figure out exactly where it landed.
Naturally, we use acoustics to do the survey. Similar to how we measured the bottom depth, we send a short "ping" from the ship to the anchor. The acoustic release (a piece of equipment attached the anchor) replies with another ping. By measuring the time it takes for this signal to travel to the bottom and back, we can figure out how far away the anchor is from the ship. The picture below shows what we might learn from making one distance measurement:

A single distance measurement tells us that the anchor could lie anywhere on that blue circle. (The distance from the ship to any point on the circle is the same.) Since we need to know the exact anchor position, we obviously have to make some more measurements. So we move the ship and make a second measurement of the travel time (thus the distance) to the anchor. The picture below shows us what that second measurement tells us:

Now we know that the anchor has to lie on both the blue and the red circles. That means that the anchor could be at one of two places (indicated by the stars on the plot). Taking a second measurement obviously narrowed down the list of possible locations for the anchor. Let's see what happens when we take a third measurement:

Now the anchor has to lie on all three circles, so we know it must be located at the intersection point (marked with a triangle). Hooray! We've found our anchor!
As you can see from this post, acoustic surveys require knowing a bit of geometry (to find the intersection points of these circles). It's a practical application of the mathematics you have learned (or will learn) in school.
We let go of the anchor at our chosen site, but the anchor doesn't fall straight to the bottom because it's being dragged back by the buoy and other equipment on the 3.5 mile wire. After the anchor has reached the bottom (it takes about 50 minutes), we have to do a survey to figure out exactly where it landed.
Naturally, we use acoustics to do the survey. Similar to how we measured the bottom depth, we send a short "ping" from the ship to the anchor. The acoustic release (a piece of equipment attached the anchor) replies with another ping. By measuring the time it takes for this signal to travel to the bottom and back, we can figure out how far away the anchor is from the ship. The picture below shows what we might learn from making one distance measurement:

A single distance measurement tells us that the anchor could lie anywhere on that blue circle. (The distance from the ship to any point on the circle is the same.) Since we need to know the exact anchor position, we obviously have to make some more measurements. So we move the ship and make a second measurement of the travel time (thus the distance) to the anchor. The picture below shows us what that second measurement tells us:

Now we know that the anchor has to lie on both the blue and the red circles. That means that the anchor could be at one of two places (indicated by the stars on the plot). Taking a second measurement obviously narrowed down the list of possible locations for the anchor. Let's see what happens when we take a third measurement:

Now the anchor has to lie on all three circles, so we know it must be located at the intersection point (marked with a triangle). Hooray! We've found our anchor!
As you can see from this post, acoustic surveys require knowing a bit of geometry (to find the intersection points of these circles). It's a practical application of the mathematics you have learned (or will learn) in school.
Last Source Mooring Deployment!
We have now deployed all six of our source moorings and confirmed that they are all working. Whew! Tomorrow we deploy our last mooring with all the hydrophones that will listen to these sources.
It doesn't take a scientist to figure out what would happen if we started with the anchor...it would sink right away! We start with the buoy because it floats. The ship then moves into the wind at a speed of about 1 knot (which is about 1 mile/hour) so the wire doesn't all pile up in one spot and get tangled. We keep feeding the wire out using a winch until we have the entire 3-1/2 miles of mooring floating on the surface behind the ship. When we reach the end we can't even see the buoy anymore! We then drop the anchor, and it pulls everything else down with it.
The wire comes in sections, usually 500 meters long, so we have to keep adding to the mooring as we go along. These shots of wire are on reels which are spun around by a winch to pay the wire out. The most important thing is to never let it go when we are adding another piece of the mooring! Sometimes we can hook onto a chain to hang onto the mooring, but if we are just adding another piece of wire there isn't anything to hook onto so we use a Yale grip, or Chinese fingers. This is a loop with 4 ropes attached that are wrapped around the wire very tightly so it looks like a braid (you can see it in the video). It holds onto the wire so tight that we can just hook onto the loop and that will hold the whole mooring.
The entire deployment takes about 10 hours, but the following video condenses it to just over a minute. Don't blink!
It doesn't take a scientist to figure out what would happen if we started with the anchor...it would sink right away! We start with the buoy because it floats. The ship then moves into the wind at a speed of about 1 knot (which is about 1 mile/hour) so the wire doesn't all pile up in one spot and get tangled. We keep feeding the wire out using a winch until we have the entire 3-1/2 miles of mooring floating on the surface behind the ship. When we reach the end we can't even see the buoy anymore! We then drop the anchor, and it pulls everything else down with it.
The wire comes in sections, usually 500 meters long, so we have to keep adding to the mooring as we go along. These shots of wire are on reels which are spun around by a winch to pay the wire out. The most important thing is to never let it go when we are adding another piece of the mooring! Sometimes we can hook onto a chain to hang onto the mooring, but if we are just adding another piece of wire there isn't anything to hook onto so we use a Yale grip, or Chinese fingers. This is a loop with 4 ropes attached that are wrapped around the wire very tightly so it looks like a braid (you can see it in the video). It holds onto the wire so tight that we can just hook onto the loop and that will hold the whole mooring.
The entire deployment takes about 10 hours, but the following video condenses it to just over a minute. Don't blink!
Saturday, April 17, 2010
Sounding Out the Ocean's Depths
We saw from the last post on CTDs that the ocean in the area where we are working is about 3-1/2 miles deep. The ocean is not necessarily flat at that depth, but it can have hills and even mountains, called seamounts, and deep trenches. When we deploy an acoustic mooring we don't want the anchor to land on the side of a seamount and go sliding down, so before we do a mooring deployment we always take a bathymetric survey to get a map of what the bottom of the ocean looks like. We then pick out a nice flat spot to put in the mooring.
We take bathymetry (bottom depth) measurements using the ship's multibeam sonar. It sends out high frequency signals (called "pings") from transducers at the bottom of the ship. When the pings hit the bottom of the ocean, they bounce back to the ship. If we measure the time it takes for the sound to travel to the bottom of the ocean and back again and we know the sound speed of the water from the CTD, we can figure out how far away the bottom is. The multibeam sonar keeps pinging as it moves, so we put together the results from thousands of pings to get a picture of the bottom like the one below. Here, blue is deep and red is more shallow. You can see there is a seamount with a red peak next to the valley where we put the mooring (indicated by the red arrow).

As you can imagine, if we drop an anchor from a ship to the ocean floor 3-1/2 miles below, it does not always land directly below the point where we dropped it. In our next post we'll describe how we find out exactly where the anchor landed. Here's a hint: acoustics again!
We take bathymetry (bottom depth) measurements using the ship's multibeam sonar. It sends out high frequency signals (called "pings") from transducers at the bottom of the ship. When the pings hit the bottom of the ocean, they bounce back to the ship. If we measure the time it takes for the sound to travel to the bottom of the ocean and back again and we know the sound speed of the water from the CTD, we can figure out how far away the bottom is. The multibeam sonar keeps pinging as it moves, so we put together the results from thousands of pings to get a picture of the bottom like the one below. Here, blue is deep and red is more shallow. You can see there is a seamount with a red peak next to the valley where we put the mooring (indicated by the red arrow).

As you can imagine, if we drop an anchor from a ship to the ocean floor 3-1/2 miles below, it does not always land directly below the point where we dropped it. In our next post we'll describe how we find out exactly where the anchor landed. Here's a hint: acoustics again!
Thursday, April 15, 2010
Good morning CTD!
The Chicks are a bit bleary-eyed this morning after getting up at 4:30 AM to make a measurement of the sound speed at the location of the acoustic mooring we put in yesterday. We need to know the sound speed in order to figure out exactly where the anchor of the mooring landed. (More on that in a future post.)
Sound speed depends on the temperature and salinity (saltiness) of the water, as well as on depth. To compute the sound speed, we first measure the salinity and temperature using an instrument called a CTD, which stands for Conductivity-Temperature-Depth. The CTD has a thermometer to measure temperature, a pressure sensor to measure depth, and a conductivity sensor to measure how well the sea water can carry an electrical current. Saltier water carries more current, so by measuring conductivity we can determine the salinity of the water.
The CTD is attached to a round frame that is lowered over the side of the ship. Since we're in very deep water (about 5600 meters or 3.5 miles!) it takes about three and a half hours for the CTD to make the trip to the bottom and back. Just to be safe, we stay about 100 meters off the bottom so that we don't risk crashing into the sea floor by mistake!

Once it's back onboard we have all the data we need to compute the sound speed. The plot below shows the measurements we made this morning (temperature, salinity, and sound speed). Note that the temperature is nice at the surface, and gets very cold down deep. The sound speed increases towards the surface due to higher temperature and increases towards the bottom due to higher pressure.

CTD's don't always have to be done so early in the morning, but we needed to get this one out of the way to leave time for some other work today. While it was painful to hear the alarm go off at 4:30 AM, we did get to see a great sunrise!
Sound speed depends on the temperature and salinity (saltiness) of the water, as well as on depth. To compute the sound speed, we first measure the salinity and temperature using an instrument called a CTD, which stands for Conductivity-Temperature-Depth. The CTD has a thermometer to measure temperature, a pressure sensor to measure depth, and a conductivity sensor to measure how well the sea water can carry an electrical current. Saltier water carries more current, so by measuring conductivity we can determine the salinity of the water.
The CTD is attached to a round frame that is lowered over the side of the ship. Since we're in very deep water (about 5600 meters or 3.5 miles!) it takes about three and a half hours for the CTD to make the trip to the bottom and back. Just to be safe, we stay about 100 meters off the bottom so that we don't risk crashing into the sea floor by mistake!

Once it's back onboard we have all the data we need to compute the sound speed. The plot below shows the measurements we made this morning (temperature, salinity, and sound speed). Note that the temperature is nice at the surface, and gets very cold down deep. The sound speed increases towards the surface due to higher temperature and increases towards the bottom due to higher pressure.

CTD's don't always have to be done so early in the morning, but we needed to get this one out of the way to leave time for some other work today. While it was painful to hear the alarm go off at 4:30 AM, we did get to see a great sunrise!
Wednesday, April 14, 2010
Safety First!
Safety is very important when we are out here in the ocean because we are over a day's steam from dry land and help! We can't just dial 9-1-1 if there is a problem, so everybody on the ship has to work together in an emergency situation. We do regular training drills on the ship so we know what to do if there is a fire or if we have to abandon ship or if somebody falls overboard. The ship's crew also instructed us how to launch the lifeboats in case of an emergency. When we hear the ship's whistle for the abandon ship drill, we all have to meet, or muster, to get a head count and make sure to bring our life vests, long pants, a long sleeve shirt, and a hat for sun protection to prepare for a situation in which we would be left bobbing around in the water for a while. The ship also provides immersion suits, or "Gumby suits," which are not the easiest things to put on (check out our video!), but
they would keep us warm and floaty if we had to jump ship.
When we are working on deck deploying a mooring, we have to be very safety conscious as well. We wear steel-toed boots because there is a lot of heavy equipment out on deck that could fall on our feet. We also wear work vests, which are not quite as bulky as life vests, but would still provide flotation in case we were to fall overboard while working on deck. The ship has 2 cranes aboard to help us move around our big, heavy equipment. Whenever we are moving things around we have to make sure to hold the equipment using tag lines (check out the photo) so it doesn't swing out of control when the ship moves with the waves. And of course, we always wear our (PINK!) hardhats.
they would keep us warm and floaty if we had to jump ship.When we are working on deck deploying a mooring, we have to be very safety conscious as well. We wear steel-toed boots because there is a lot of heavy equipment out on deck that could fall on our feet. We also wear work vests, which are not quite as bulky as life vests, but would still provide flotation in case we were to fall overboard while working on deck. The ship has 2 cranes aboard to help us move around our big, heavy equipment. Whenever we are moving things around we have to make sure to hold the equipment using tag lines (check out the photo) so it doesn't swing out of control when the ship moves with the waves. And of course, we always wear our (PINK!) hardhats.
Sunday, April 11, 2010
Anatomy of an Acoustics Mooring

Taking measurements in the ocean is a lot different than taking measurements on land. If you want to take a temperature measurement on land, you don't have to worry about your sensor floating away! Oceanographic moorings anchor instruments to the bottom so they can stay in the same place for long periods of time. We want to make acoustic measurements for a year, and we need our sound sources and receivers to stay put, so we install, or deploy, acoustic moorings.
An acoustic source mooring, like the one shown on the left, consists of an anchor at the bottom and a buoy at the top with the source suspended in between. It is all connected by shackles and chains, and, most of all, jacketed wire rope. You can think of wire rope as the skeleton of the mooring. Everything between the anchor and the buoy is attached to it.
The buoy at the top is a subsurface buoy, meaning that it does not bob around in the waves at the surface, but it sits about 180 meters below the ocean surface so that passing ships will not hit it. The buoy provides flotation so that the wire will be pulled tight and the mooring will stand up straight.
Because the mooring is over 5 km long, we need some additional buoyancy to help the buoy keep the mooring as straight as possible. For this we use glass spheres that are filled with air so they float. These glass spheres are encased in hard yellow plastic shells so there is a way to attach them to the rest of the mooring and to protect them so they don't crack.

In the mooring drawing we show here, the sound source is located 1050 meters below the surface. Above the source is an array of four hydrophones. These four hydrophones will listen to the other sources that we deploy and the other source moorings will listen to this source. We also have an ADCP (Acoustic Doppler Current Profiler) on this mooring, which sends out much higher frequency sound in the upward direction, which will be used to measure the strength and direction of the currents passing over it. A picture of the ADCP and some of the other mooring elements is shown on the right. Pictures of the glass balls and anchors can be seen in our earlier post describing the loading of the ship.
These moorings will stay in the water for a whole year collecting data, but what happens when that year is over and we want to get our hands on the data? We have to go back to the mooring location and pop up the mooring and bring it back onto the ship. It would b
e pretty difficult to bring a 2-ton anchor back on board so, well, we don't. Just above the anchor we have 2 acoustic releases. These instruments have a hook (where the red arrows are pointing in the picture on right) that stays locked on a chain that is attached to the anchor. When we go back to pick up the moorings, we send out a special coded acoustic signal from the ship, and when the acoustic release "hears" it, it unhooks the chain to the anchor and floats up to the surface with the rest of the mooring, leaving the anchor on the bottom.
e pretty difficult to bring a 2-ton anchor back on board so, well, we don't. Just above the anchor we have 2 acoustic releases. These instruments have a hook (where the red arrows are pointing in the picture on right) that stays locked on a chain that is attached to the anchor. When we go back to pick up the moorings, we send out a special coded acoustic signal from the ship, and when the acoustic release "hears" it, it unhooks the chain to the anchor and floats up to the surface with the rest of the mooring, leaving the anchor on the bottom.Saturday, April 10, 2010
How signal processors earn their paychecks
As we noted earlier, acoustic tomography relies on accurate measurements of the time it takes for a signal to travel between a source and a receiver. The speed of sound depends on the water temperature. Since sound travels faster in warmer water, we would expect the travel time between two points to get shorter as the water warms up.
Yesterday we showed you what the source signal looks and sounds like. That recording was made during one of source tests conducted a couple days ago. During these tests the source was lowered on a wire from the ship to a depth of about 1 kilometer. The receiver was located on the same wire, about 500 meters above the source. Since the receiver was so close to the source, it was quite easy to hear it.
In a typical acoustic tomography experiment the source and receiver are much further apart. In the experiment we are setting up right now, the shortest range between source and receiver is about 125 kilometers, and the longest range is about 640 kilometers! Since sound signals lose energy as they travel, hearing them at these long distances is difficult. The picture below shows the signal received from one of these sources at a range of 500 kilometers:

Can you tell where the signal starts and ends? Probably not from this picture! In order to see when the signal arrives, we have to use tools developed by signal processors. Applying these tools to the signal above, we get the following picture:

This picture is a lot easier to read since it contains only two big spikes. These spikes correspond to the arrival times of two signals.
Signal processors earn their paychecks by designing signals (like the one we're using) and processing tools to make those signals easier to detect at long distances. In addition to oceanographic applications, signal processing is also used in cellular phones, digital tv's, MP3 players, and lots of other electronic devices. Most signal processors are trained as electrical engineers (like Kathleen). If you're interested in learning more about signal processing, feel free to email Kathleen. You can find her email address on her website.
Yesterday we showed you what the source signal looks and sounds like. That recording was made during one of source tests conducted a couple days ago. During these tests the source was lowered on a wire from the ship to a depth of about 1 kilometer. The receiver was located on the same wire, about 500 meters above the source. Since the receiver was so close to the source, it was quite easy to hear it.
In a typical acoustic tomography experiment the source and receiver are much further apart. In the experiment we are setting up right now, the shortest range between source and receiver is about 125 kilometers, and the longest range is about 640 kilometers! Since sound signals lose energy as they travel, hearing them at these long distances is difficult. The picture below shows the signal received from one of these sources at a range of 500 kilometers:

Can you tell where the signal starts and ends? Probably not from this picture! In order to see when the signal arrives, we have to use tools developed by signal processors. Applying these tools to the signal above, we get the following picture:

This picture is a lot easier to read since it contains only two big spikes. These spikes correspond to the arrival times of two signals.
Signal processors earn their paychecks by designing signals (like the one we're using) and processing tools to make those signals easier to detect at long distances. In addition to oceanographic applications, signal processing is also used in cellular phones, digital tv's, MP3 players, and lots of other electronic devices. Most signal processors are trained as electrical engineers (like Kathleen). If you're interested in learning more about signal processing, feel free to email Kathleen. You can find her email address on her website.
Friday, April 9, 2010
What do our source and a trombone have in common?

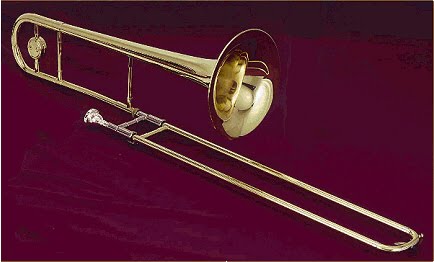
The picture below shows one of our acoustic sources being moved into the warehouse in Kaohsiung. This type of source is similar to a trombone. To change the pitch on the trombone, the trombonist moves the slide in or out, which changes the length of the instrument and alters the pitch (frequency). To change the pitch our source is playing, we adjust its length by moving part of the black tube.

Our source produces sound in the band of frequencies between 225 and 325 Hz. For reference, 261 Hz is the C below middle C on the Western musical scale. A baritone singer could easily sing our source signal (though we haven't found any singers eager to be lowered to a depth of 1000 meters in the ocean just to sing for a year!).
Our source plays a very simple type of "music". The figure below shows a picture of the signal we recorded during one of our source tests this week. If you click on the picture, you'll hear what the source sounds like.
The source signal is the humming sound that increases in pitch over time. The picture below (called a spectrogram) shows how the frequency of the source signal changes with time. The source signal corresponds to the dark red line. From this picture you can see that the source starts at a frequency of 225 Hz and slowly increases to 325 Hz over a period of 135 seconds.

While this signal may not make any of the Top 40 music charts, it is very useful to acoustic tomographers. We'll show you more about this in a later post when we discuss how signal processors (like Kathleen) earn their paychecks!
Subscribe to:
Posts (Atom)